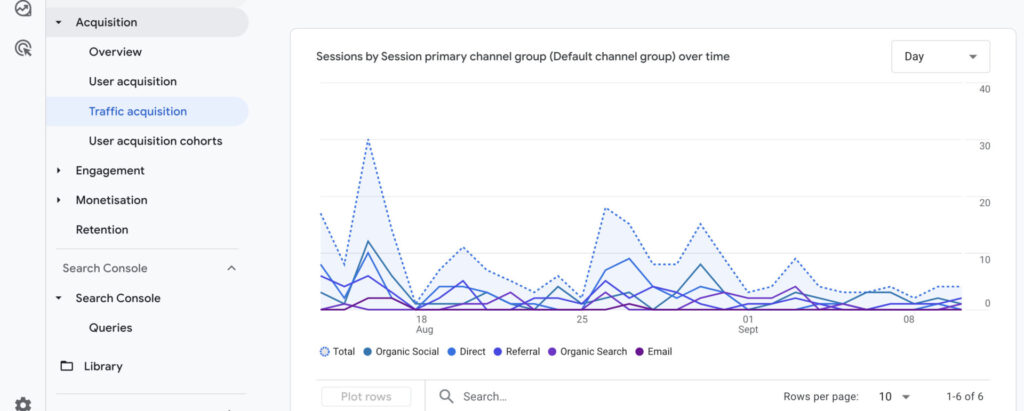
We will focus on creating a BigQuery traffic acquisition report similar to the one in GA4.
Moving to BigQuery is the first steps to having more control over the data you collect. But once the data is there, you still need to query the exported tables to get the metrics and dimensions you want.
How to enable Bigquery Export
If you did not enable the GA4 export to BigQuery, check to this guide to get started.
This standard report very useful to understand where your traffic is coming from and dig deeper into each channel.
Traffic acquisition query structure
We are going to break this query to 3 stages:
- We are going to unnest the basic metrics that are available at the event level.
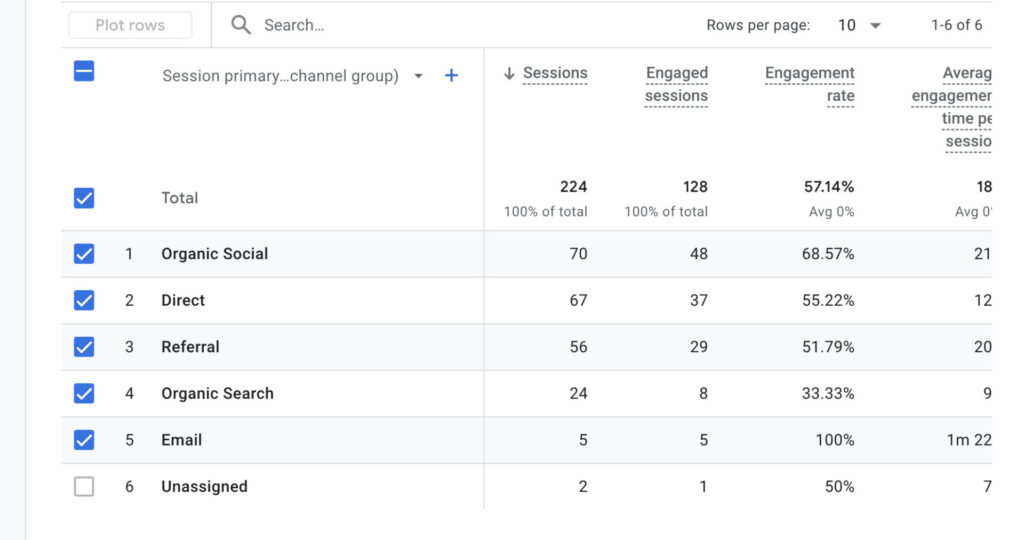
- Next, we work on creating a custom channel group like the one you see in the table below the chart in acquisition report
What unnesting means?
GA4 is an event-based tool. When we export data to BigQuery, each event has many nested rows containing data, such as which page the event was triggered on. To access this data, you need to extract the specific field (e.g., the page location) from the nested row.

Example of a nested row.
In the last step, we will calculate all the session metrics before scheduling our query.
Step #1: defining the query fields
- Dimensions
By looking at the fields in the GA4 acquisition report, we can get an idea of what fields we need to construct the query.
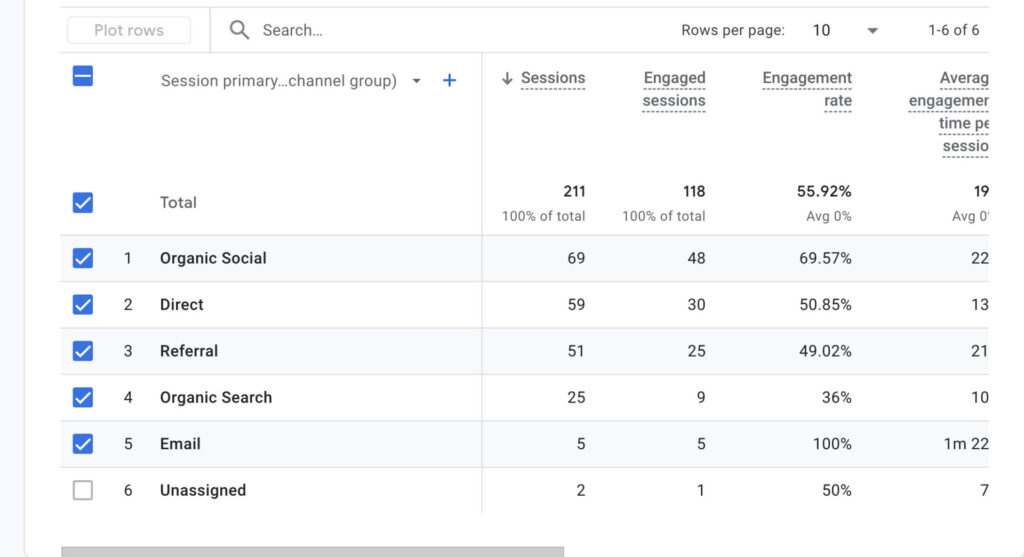
Here are some of the most important dimensions we will use in our query:
| Dimension | Description |
|---|---|
| Default channel group | How GA4 groups traffic from different channels: social organic, paid search, and so on. |
| Session medium | Broad definition of traffic coming from a source: paid, organic, email… |
| Session source | The name of the platform or website where traffic is coming from: Google, Facebook, LinkedIn… |
| Session campaign | The campaign name you added to the UTM parameter |
| Key event | The name of the conversion that occurred on your website, if you defined one: purchase, sign-up, download… |
We will extract other fields related to geography (city, region, etc.) and device information, but they are not as important as the dimensions we will use for attributing each session.
- Metrics
For the metrics, they are going to revolve around sessions, similar to how the report is structured in GA4.
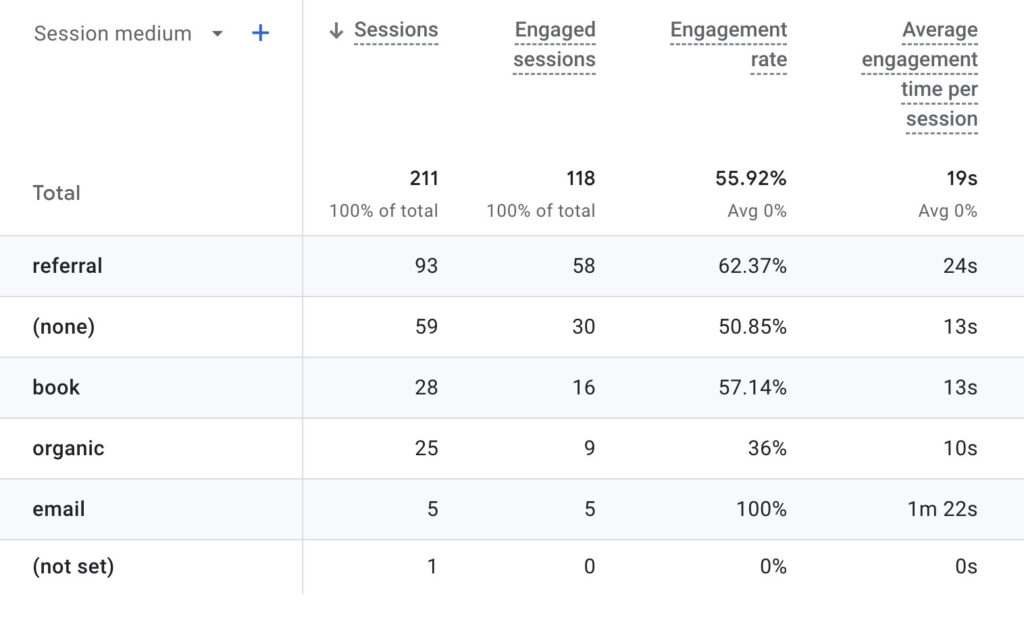
With that being said, here is a list of the metrics we will recreate using our query.
| Metric | Description |
|---|---|
| Sessions | The count of visits (sessions). |
| Engaged Sessions | Sessions that meet GA4’s criteria to be considered as engaged: “An engaged session is a session that lasts longer than 10 seconds, has a key event, or has at least 2 page views or screen views.” |
| Engagement rate | When you divide the engaged sessions by total sessions, you get the engagement rate. |
| Average engagement time per session | Average session duration is calculated by dividing total engagement time by the number of sessions. |
| Sessions Key event rate | The old gold conversion rate, now rebranded by GA4, is calculated by dividing key events (conversions) by total sessions to get the average conversion rate per session. |
Step #2: extracting the query fields
WITH flat_table AS (
  SELECT
    parse_date('%Y%m%d', event_date) AS date,
    event_name,
    event_timestamp,
    -- 1️⃣ Define conversions
    CASE WHEN event_name IN ('file_download', 'invitee_meeting_scheduled') THEN event_name END AS key_event,
    -- 2️⃣ Get session ID, define sessions, and engaged sessions
    (SELECT value.int_value FROM UNNEST(event_params) WHERE key='ga_session_id') AS session_id,
    CONCAT((SELECT value.int_value FROM UNNEST(event_params) WHERE key='ga_session_id'), user_pseudo_id) AS unique_sessions,
    (SELECT value.string_value FROM UNNEST(event_params) WHERE key='session_engaged') AS session_engaged,
    (SELECT value.int_value FROM UNNEST(event_params) WHERE key='engagement_time_msec') AS   engagement_time_msec,
    -- 3️⃣ Obtain source, medium, and campaign for accurate session attribution.
    traffic_source.name AS campaign,
    traffic_source.source AS source,
    traffic_source.medium AS medium,
    geo.country,
    geo.city,
    geo.region,
    device.category,
    device.operating_system,
    device.mobile_os_hardware_model,
  FROM `<project_id>.events_*` -- Replace <project_id> with your project ID
  -- 4️⃣ Dynamic date range for data retrieval using a 6-month window.
  WHERE _table_suffix BETWEEN FORMAT_DATE('%Y%m%d', DATE_SUB(CURRENT_DATE(), INTERVAL 6 MONTH))
                           AND FORMAT_DATE('%Y%m%d', DATE_SUB(CURRENT_DATE(), INTERVAL 1 DAY))
)The query may be lengthy, but it’s quite straightforward. You can understand my approach by reviewing the comments in sections 1️⃣, 2️⃣, and so forth.
- 1️⃣ We first defined the conversions manually, as our GA4 exported table lacks a conversions field.
- 2️⃣ Next, we extracted fields like session ID.
- We defined a session by combining the user pseudo ID and session ID
- We extracted a parameter
session_engagedthat we will use in subsequent queries to define an engaged session.
ℹ️ Formula to unnest an event parameter
Use this to extract an integer value for a given parameter.
(SELECT value.int_value FROM UNNEST(event_params) WHERE key='event_key') AS any_name_here
Alternatively, you can use a string value instead of in_value to retrieve the text if a string value exists.
3️⃣ In the 3rd step, we extracted some fields to attribute traffic, namely source, medium, and campaign; we will use the source and medium later on to define channel groups.
Step #3: basic metrics calculation and channel grouping
We will use yet another common table expression (CTE) as an intermediate step where we calculate some basic metrics using the fields flat_table.
basic_metrics as(
select
    date,
    source,medium,campaign,
  -- Conver engagement time to seconds
  engagement_time_msec/1000 as engagement_time,
  key_event,
  -- 1️⃣ Define engaged sessions
  CASE WHEN session_engaged = '1' THEN session_id END AS engaged_session,
  unique_sessions
   -- Country and device dimensions
    country, city, region, category, operating_system, mobile_os_hardware_model,

  -- 2️⃣ Custom channnel group definition
 case
        when (source = 'direct' or source is null)
            and (regexp_contains(medium, r'^(\(not set\)|\(none\))$') or medium is null)
            then 'Direct'
        when regexp_contains(campaign, r'^(.*shop.*)$')
            and regexp_contains(medium, r'^(.*cp.*|ppc|paid.*)$')
            then 'Shopping Paid'
        when regexp_contains(source, r'^(google|bing)$')
            and regexp_contains(medium, r'^(.*cp.*|ppc|paid.*)$')
            then 'search_paid'
        when regexp_contains(source, r'^(twitter|facebook|fb|instagram|ig|linkedin|pinterest)$')
            and regexp_contains(medium, r'^(.*cp.*|ppc|paid.*|social_paid)$')
            then 'Social Paid'
        when regexp_contains(source, r'^(youtube)$')
            and regexp_contains(medium, r'^(.*cp.*|ppc|paid.*)$')
            then 'Video Paid'
        when regexp_contains(medium, r'^(display|banner|expandable|interstitial|cpm)$')
            then 'Display'
        when regexp_contains(medium, r'^(.*cp.*|ppc|paid.*)$')
            then 'Other Paid'
        when regexp_contains(medium, r'^(.*shop.*)$')
            then 'Shopping Organic'
        when regexp_contains(source, r'^.*(twitter|t\.co|facebook|instagram|linkedin|lnkd\.in|pinterest).*')
            or regexp_contains(medium, r'^(social|social_advertising|social-advertising|social_network|social-network|social_media|social-media|sm|social-unpaid|social_unpaid)$')
            then 'Social Organic'
        when regexp_contains(medium, r'^(.*video.*)$')
            then 'video_organic'
        when regexp_contains(source, r'^(google|bing|yahoo|baidu|duckduckgo|yandex|ask)$')
            or medium = 'organic'
            then 'Search Organic'
        when regexp_contains(source, r'^(email|mail|e-mail|e_mail|e mail|mail\.google\.com)$')
            or regexp_contains(medium, r'^(email|mail|e-mail|e_mail|e mail)$')
            then 'Email'
        when regexp_contains(medium, r'^(affiliate|affiliates)$')
            then 'Affiliate'
        when medium = 'referral'
            then 'referral'
        when medium = 'audio'
            then 'Audio'
        when medium = 'sms'
            then 'SMS'
        when ends_with(medium, 'push')
            or regexp_contains(medium, r'.*(mobile|notification).*')
            then 'Mobile Push'
        else 'Other'
    end as custom_channel_group,

from flat_table)In the basic_metrics, we first defined what is an enaged session at 1️⃣. This was done useing a field that returns 1 when a session was labled as enagegd. Next, we went straight to the definition of the custom channel groups at 2️⃣. We used case statements to define each channel.
ℹ️ Case statements
Case statements are very similar to an if statement in Excel; the operating principle is the same
if a value matches the confdition then do X.
Step #4: final calculations of Traffic acquisition metrics
In the final step, we will levarge the metrics and diemnsion we created in basic_metrics.
select
    date,
    -- 1️⃣  Make attribution session-level
    max(source) as source,
    max(medium) as medium,
    max(campaign) as  campaign,
    max(custom_channel_group) as channel_group,
    country,
    city,
    region,
    category,
    operating_system,
    mobile_os_hardware_model,
    key_event as conversion,
    -- 2️⃣ Calculate session metrics
    round(safe_divide(count(key_event),count(unique_sessions)),2) as conversion_rate,
    count(key_event) as conversions,
    round(safe_divide(sum(engagement_time),count(unique_sessions)),2) as engagement_time_per_session,
    round(safe_divide(count(engaged_session),count(unique_sessions)),2) as enagement_rate,
    count(distinct unique_sessions) as sessions,
    count(distinct engaged_session) as engaged_sessions,
from basic_metrics
group by date,country, city, region, category, operating_system, mobile_os_hardware_model,conversion--,channel_group
order by date descIn the last query, we use the max() function to make source, medium, and campaign session-based (at 1️⃣ ). A returning user might come from different sources over a month, so we only want to capture the most recent channel they used. This way, we avoid having different channel values for the same date.
At 2️⃣ , we calculated the conversion rate by dividing the count of key events by the number of sessions. the use of safe_divide() is a good practise to not get an error when dividing by 0.
ℹ️ safe_divide()
Takes 2 arguments:
• numerator: The value you want to divide.
• denominator: The value by which you want to divide the numerator.
SAFE_DIVIDE(numerator, denominator)
Step #5: test and compare traffic acquisition reports
We will run the query, then explore it in Looker Studio. This will let us compare data over a specific time range and check if the numbers are close to GA4.
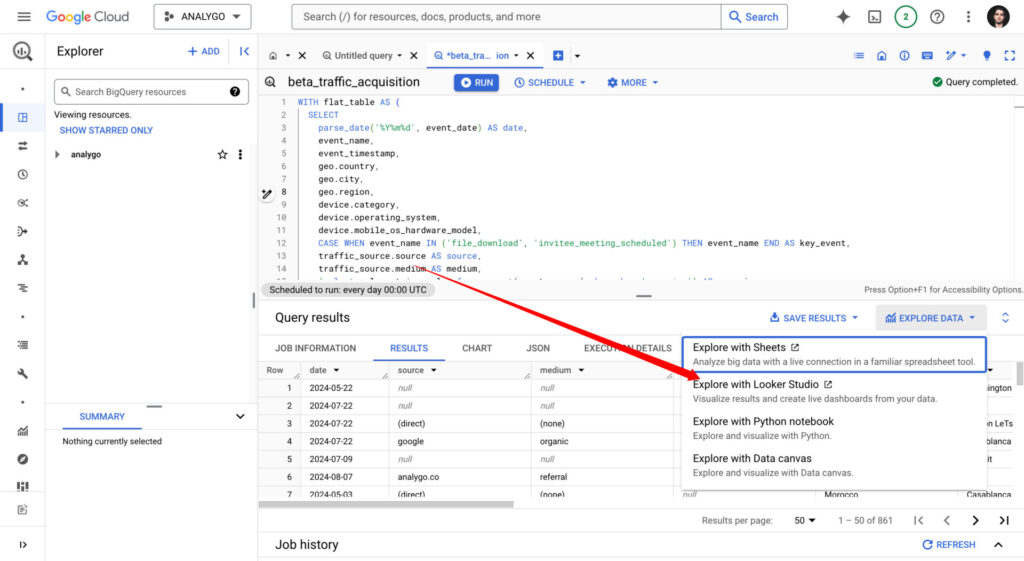
When i compare the data for a 30 day period here are the results i get:
- Bigquery Acquisition report – Sesssions: 233
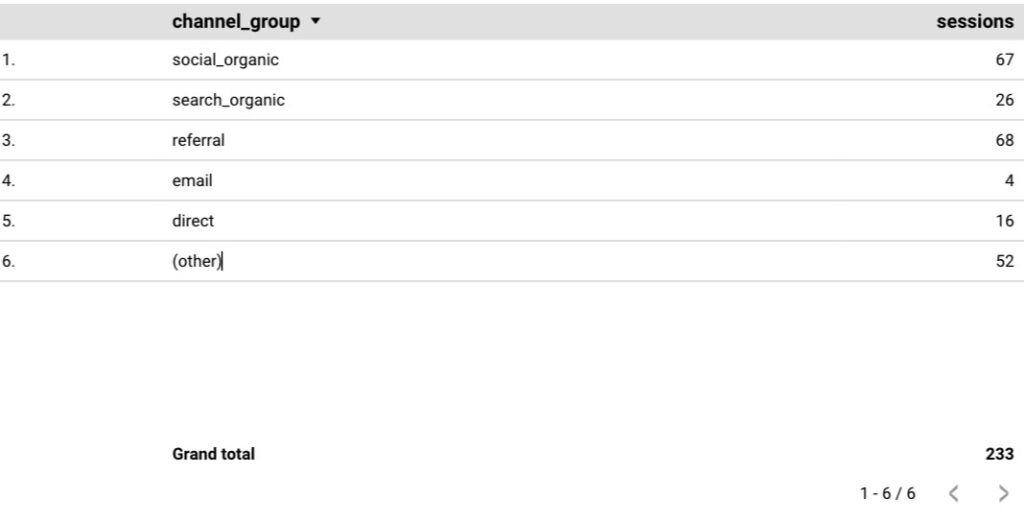
GA4 Acquisition report – Sesssions: 213
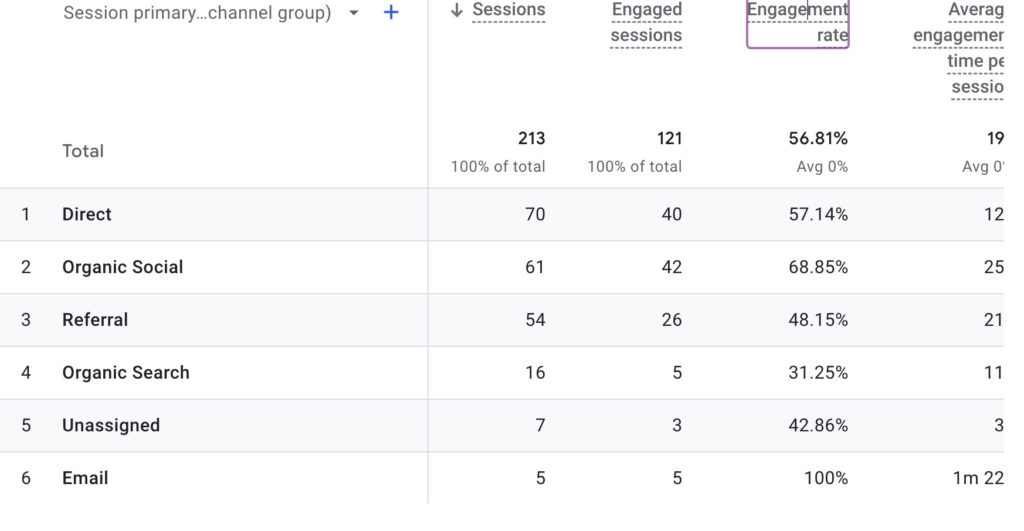
We have a difference of about 9% which is not that bad. Of course getting 100% is ideal but unfortunately it can be quite hard to achieve. As long as the difference is acceptable you can move on with your day.

