Once you link GA4 to BigQuery, understanding how the data is organized within the BigQuery interface is key to making the most of your data.
Note: If you didn’t link GA4 to BigQuery, you can start with this guide and comeback later.
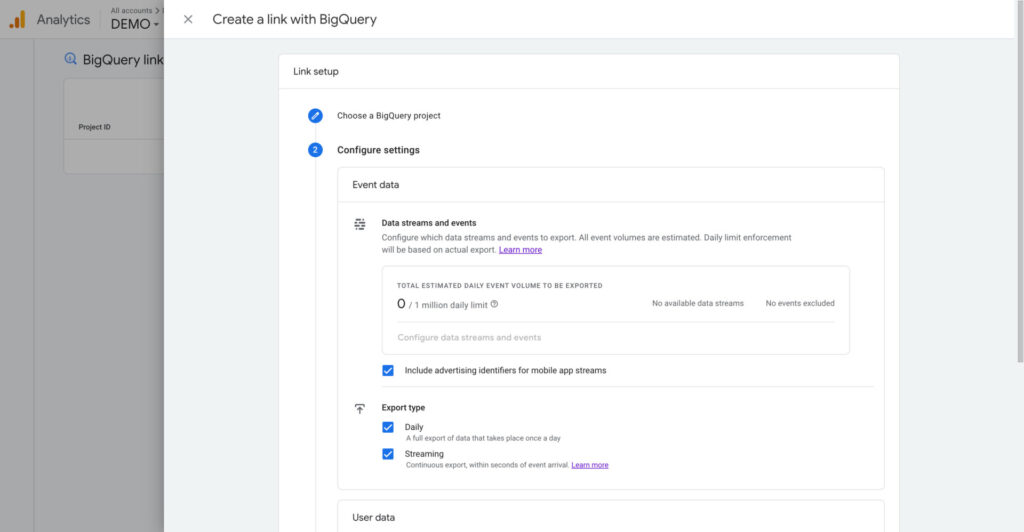
How BigQuery Imports your GA4 Data?
Projects, Datasets, and tables
When you link GA4 to BigQuery, your data is imported in a certain way. Your data is imported into the project you created when you configured up your BigQuery account. A project is the container where your data set is stored.
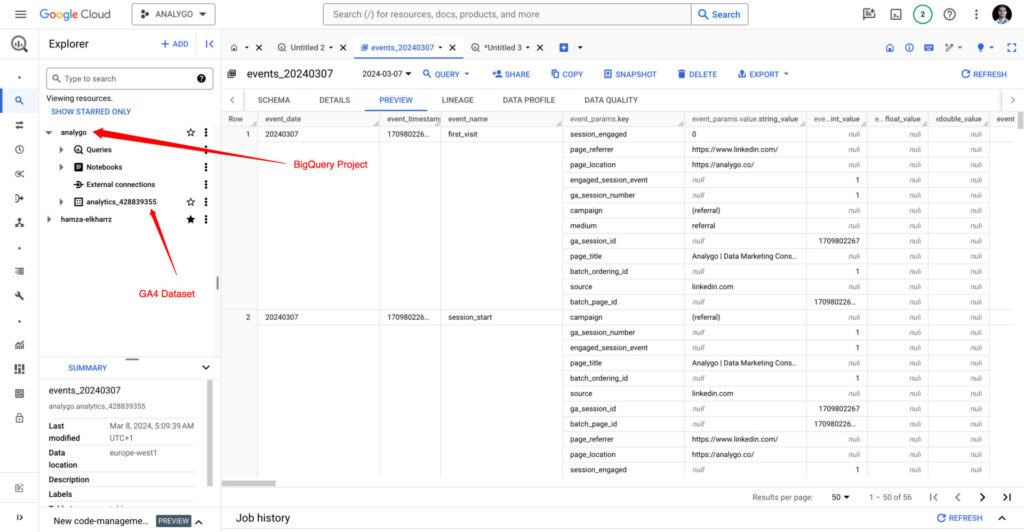
You will find multiple tables when you select your dataset, each table serves a specific goal. We can break them into two categories:
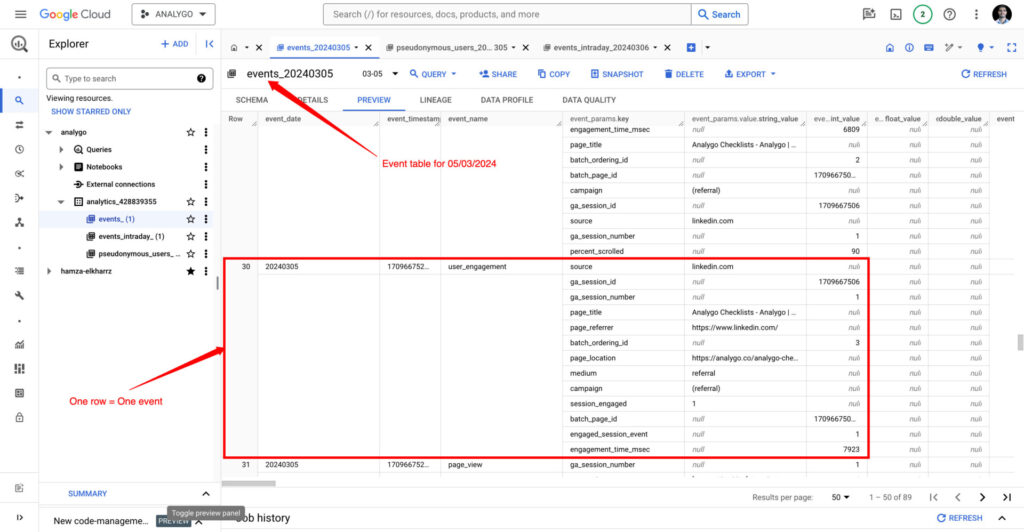
Category 1: Event tables
Daily event export
Your events are imported into a table called events_[Number of days since you linked GA4 to BigQuery].
(Almost) Real-time event export
The second table, events_interday_[Number of days since you linked GA4 to BigQuery], is the equivalent of the real time report you find in GA4. This table won’t be available unless you enabled streaming report when you linked GA4 to BigQuery.
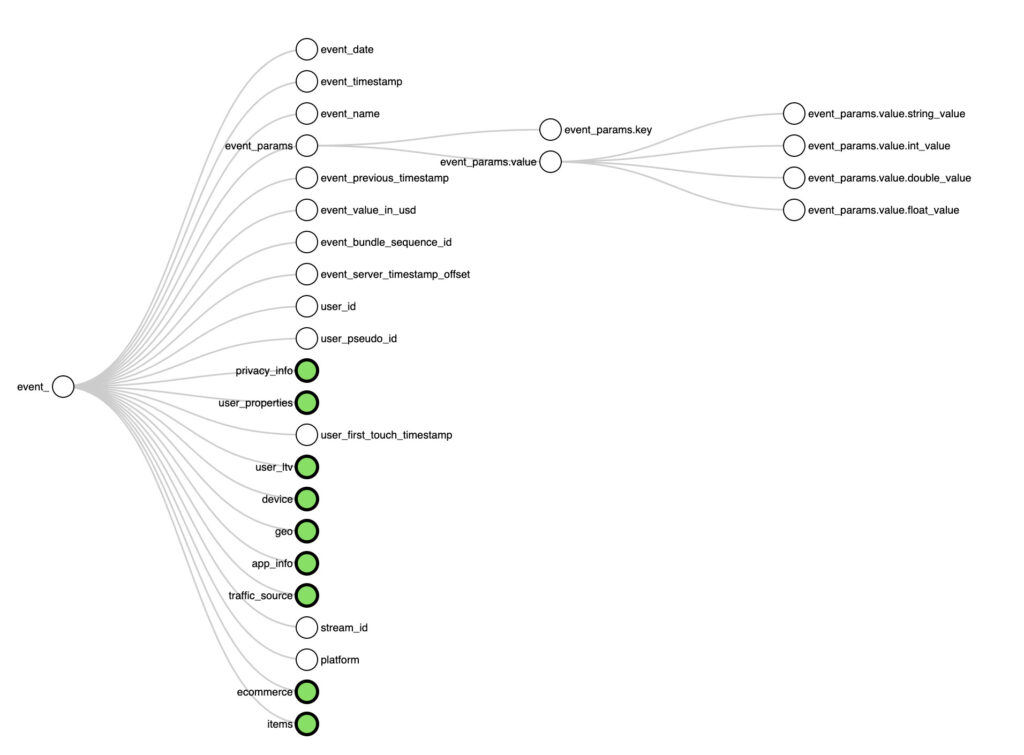
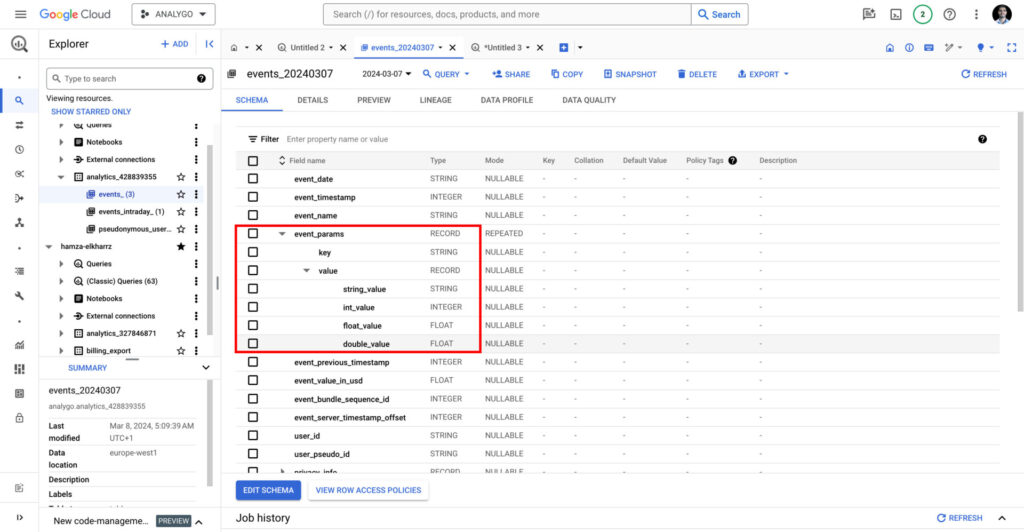
How event data is structured in BigQuery?
Events are a key component in how GA4 works. Each event is stored in a row with its own unique information.
There are nested values in each row, which can be a bit overwhelming to look at if it’s your first time using BigQuery. Each of the events have parameters. some are native to GA4 (page title) and others you created to customize your tracking.
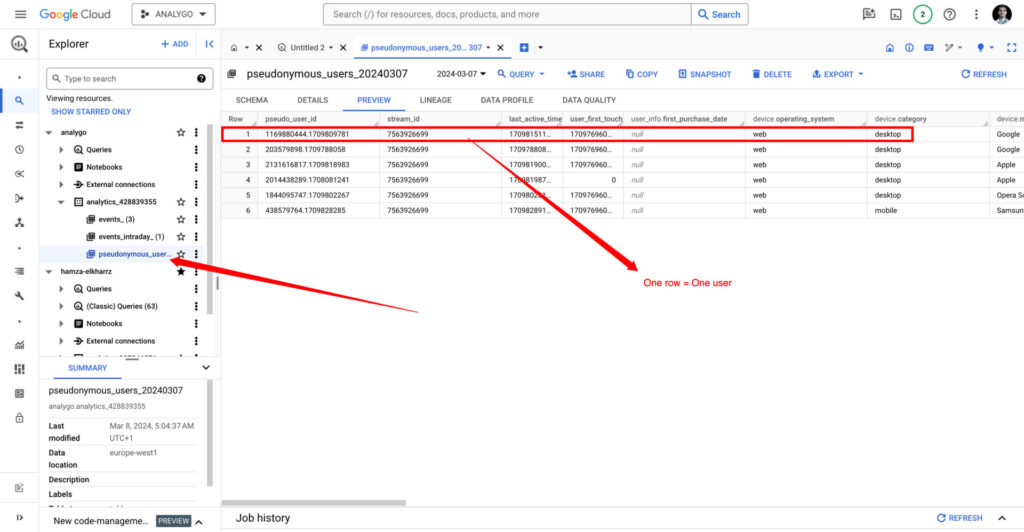
Category 2: user tables
The second category is all about user data. Here the logic of the tables is about individual users instead of the actions they take (aka events).
Final words
Although looking at a BigQuery table with GA4 data can be overwhelming at first sight, you will gain a better understanding of the behind the scenes organization of your event and user data. This will help when the time comes to query your data and answer questions. It all starts with understanding how the pieces fit together.
I always find it easier to visualize data using the tree analogy, the trunk is your event and the brunches are the different columns.