Our previous Dataform article was all about getting you started by setting up the environment. Today we will talk about the actual interface and how to organize your files. We will even run our first query!
Dataform UI Overview And Recommendations
When you create your first development space, you will land on the page below.
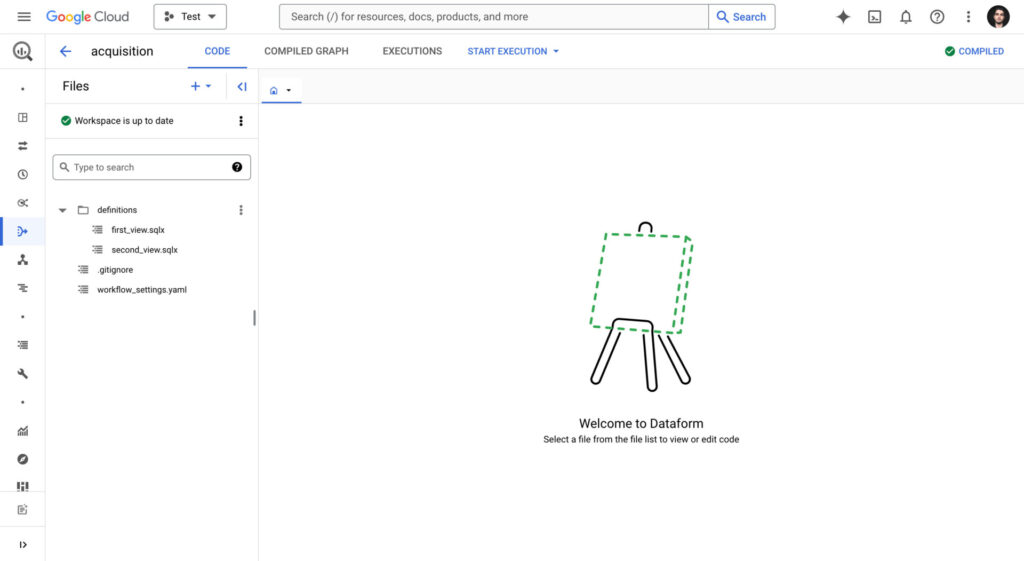
We will use the side panel to access our files and store our queries. For now, there is only one directory called definitions. Dataform documentation recommends adding more structure to our workspace.
Creating Subdirectories To Manage Workflow
Inside definitions, I will create 3 subdirectories by clicking on the 3 dots next to definitions and selecting Create directory
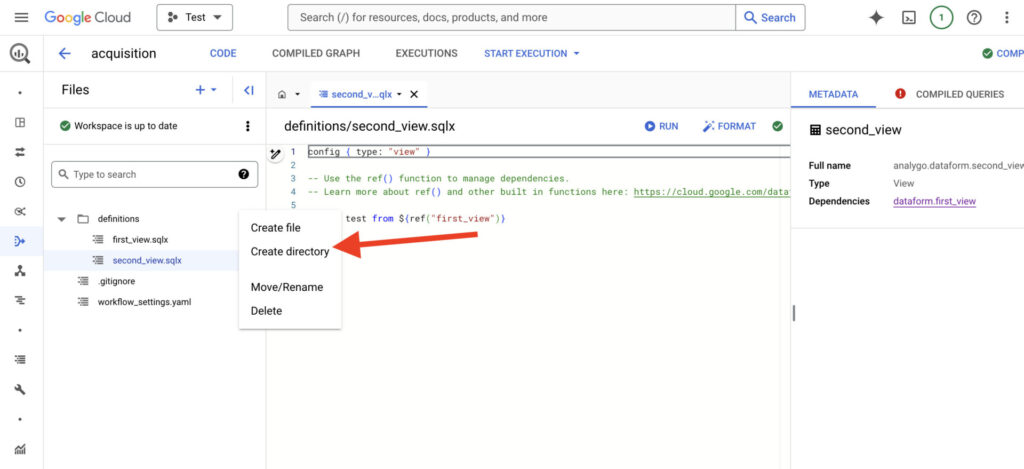
sources: The sources directory will hold our original tables.intermediate: after we make changes to our original tables like joining them with other tables, we should add the new query in thisdirectory.output: as the name indicates, we will use outputs for visualizing our data using BI tools like Looker. They are production-ready tables.
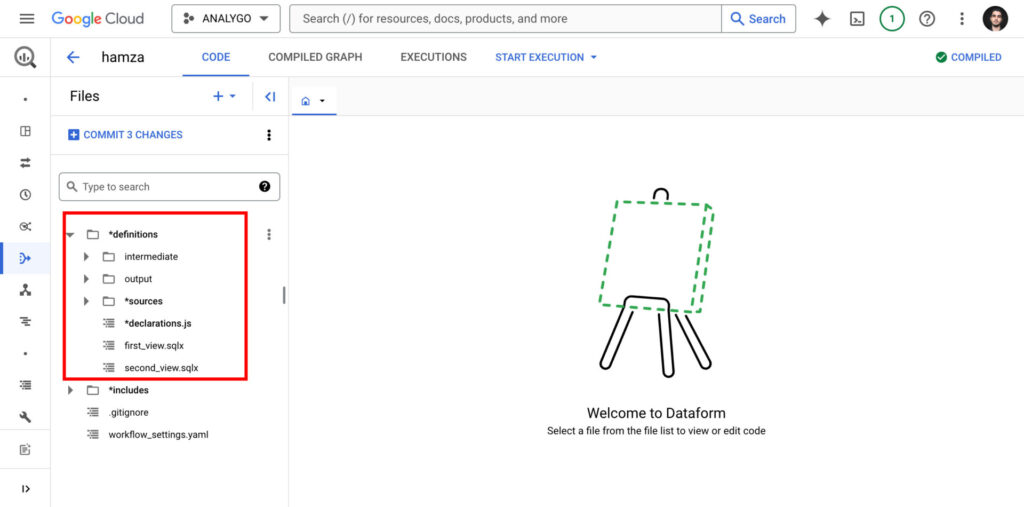
Once you create all the directories, you will have a structure similar to the screenshot above.
ℹ️ SQLX files
A lot of the work in the Code tab will revolve around creating sqlx files. They store SQL queries with the ability to use JavaScript in them.
This expands what you can do compared to plain SQL, as we will see later. You will be able to remove a lot of redundancies and store reusable code that you can use across your workspace.
Creating a SQLX query in Dataform
Let’s go ahead and create our first query. We will create a very simple table to display our sessions counts for each day.
In our sources directory, let’s first create another directory just below sources. We will call it ga4, and it will host our GA4 data.
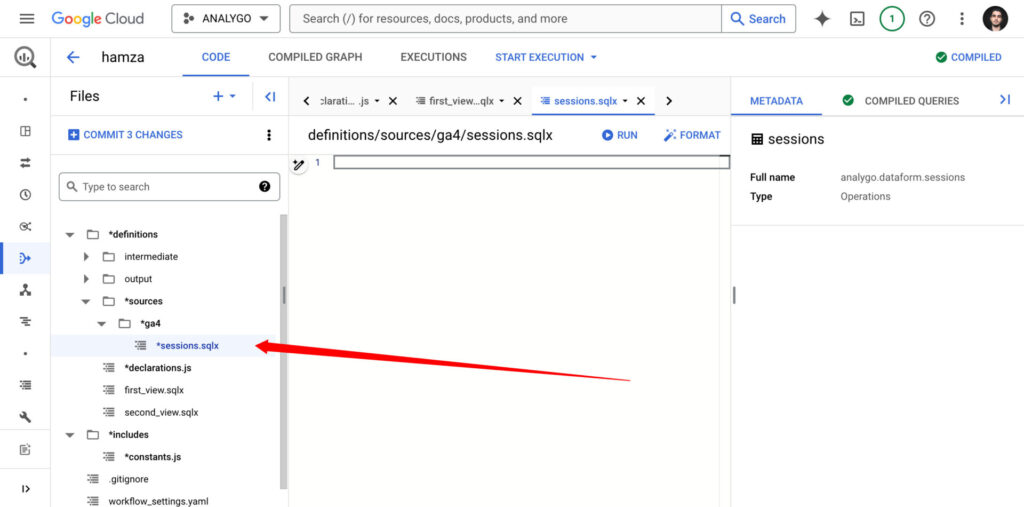
Create a new SQLX file called sessions.sqlx.
config {
    type: "table",
    schema: "dataform_ga4_sources",
    tags:["daily","GA4"]
}


SELECT
event_date as date,
(select value.string_value from unnest(event_params) where
count((select value.int_value from unnest(event_params) where key='ga_session_id'))  as sessions,

FROM `analygo.analytics_428839355.events_2024*`
group by date , source

order by date desc The only thing that will probably stand out to you is the config{} block. We use it to provide additional information about the executed query.
type: aside from tables, you can create views, incremental tables and other types depending on the usage case. We will explore these in other articles.schema: our query above will be stored indataform_sources. you can use this property to group tables under a specific schema.tags: very handy to add extra labels for a table. for instance, if you update a table daily, the tag ‘daily’ can help you distinguish it.
There is more to config{}
there are other properties that we’ll explore later on, but for now just remember that a config{} bloc help us define attributes about the SQLX query.
Time to run our query. Click on the run button right above the SQLX file to the right.
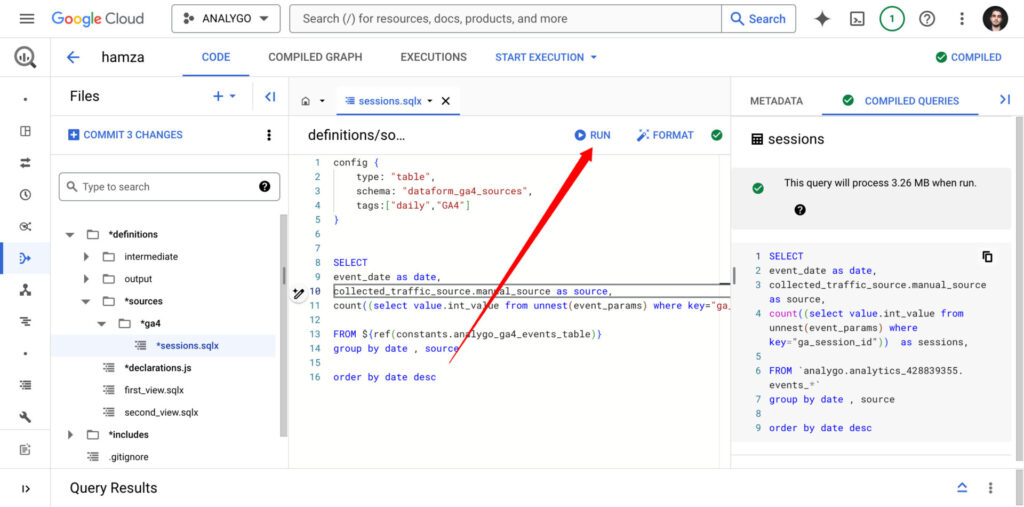
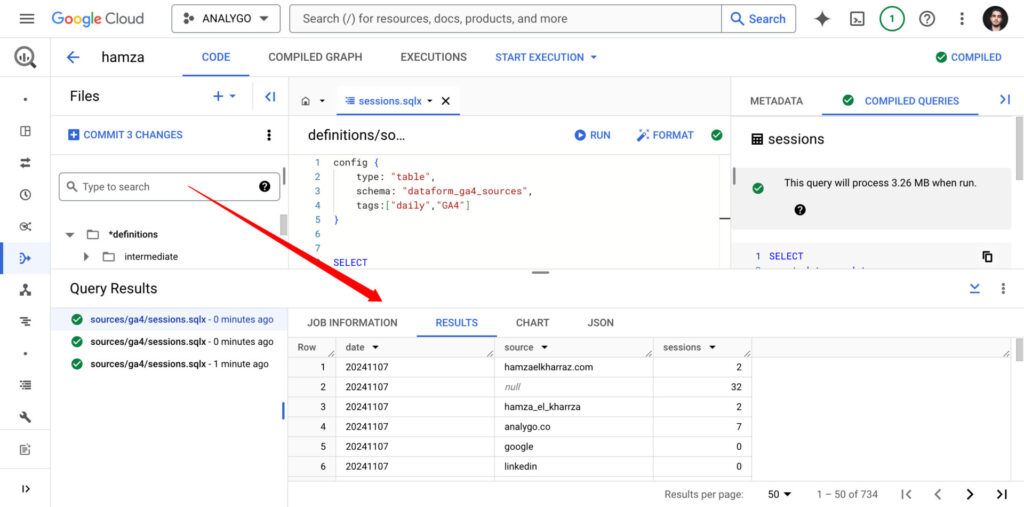
Much like the BigQuery console, we will get the results as a table below our query.
Using JavaScript in Dataform
Let’s say we want to reference our table analygo.analytics_428839355.events_2024* in other queries without having to remember our data source name each time.
One way to pull this off is by creating a separate JavaScript file.
Using a separate JavaScript File
We can store our table name in a constants.js and reference it whenever we need to retrieve a variable
Let’s start by creating this file in the includes directory.
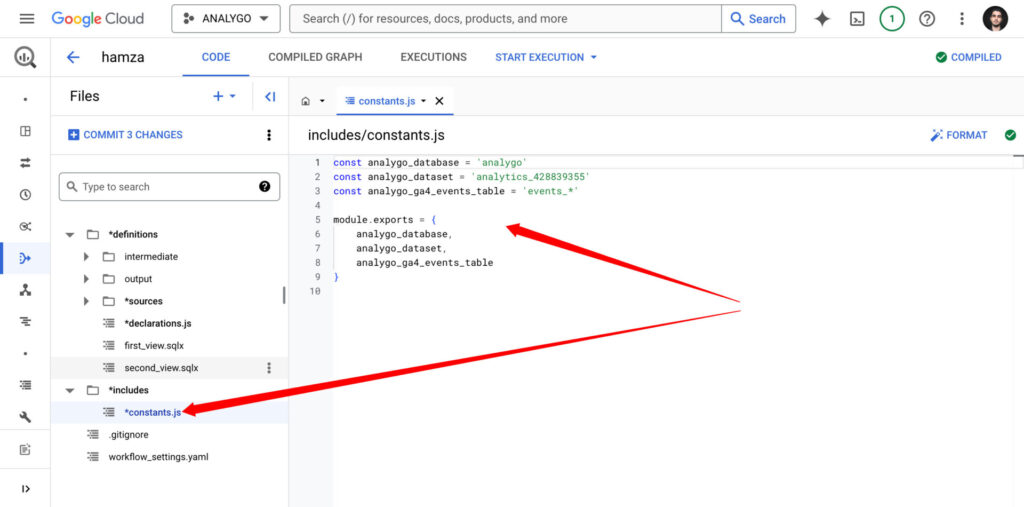
Now, we can create a declarations.js file.
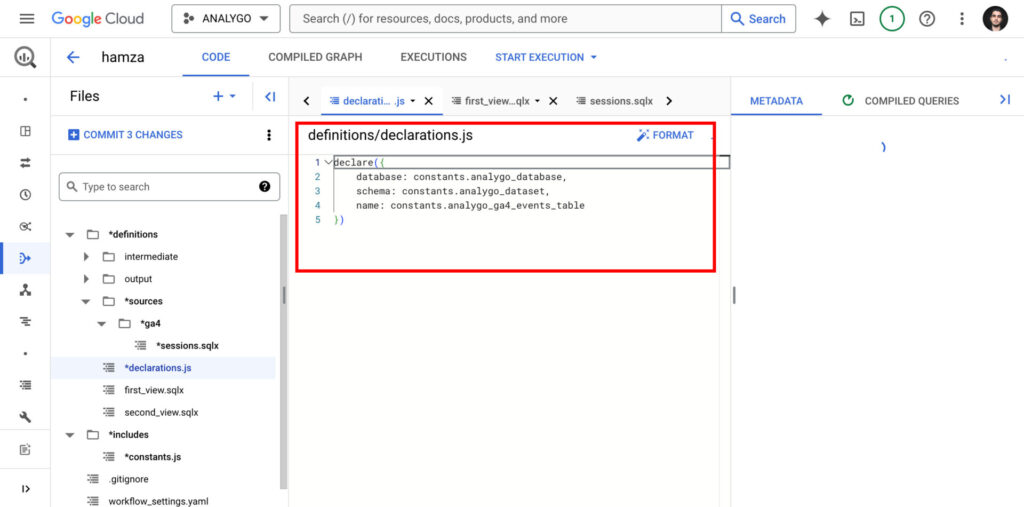
How to use the declarations.js file
From now on, we will use this file to centralize the referencing of our data sources. This will make managing our data pipeline easier, as you will see in the upcoming articles.
Finally, we can reference our table within the query.
config {
    type: "table",
    schema: "dataform_ga4_sources",
    tags:["daily","GA4"]
}


SELECT
event_date as date,
collected_traffic_source.manual_source as source,
count((select value.int_value from unnest(event_params) where key="ga_session_id"))  as sessions,


FROM ${ref(constants.analygo_ga4_events_table)}
group by date , source

order by date desc ref() function in Dataform
The ref() is a great way to manage dependencies between tables. We can use each time we want to reference our data source without adding it repeatedly.
Inline JavaScript
Another method is writing JS code directly in the SQLX. Let’s use our sessions.sqlx file as an example. I will replace collected_traffic_source.manual_source with a JS constant called source.
config {
    type: "table",
    schema: "dataform_ga4_sources",
    tags:["daily","GA4"]
}

-- Here, we define a JavaScript block to create a variable named 'source'.
js {
 const source = 'collected_traffic_source.manual_source as source';  -- This sets 'source' to refer to a specific column in our data, renaming it to 'source' for clarity.
}

SELECT
event_date as date,

${source} -- We use the previously defined JavaScript variable 'source' here, which represents a specific column from our data,

count((select value.int_value from unnest(event_params) where key="ga_session_id"))  as sessions,

FROM ${ref(constants.analygo_ga4_events_table)}
group by date , source

order by date desc This can be very useful if you have several fields you add repeatedly to your queries. You can simply store them in a constant and reference them.

